Hi, how can we help you?
How to check deal performance report?
This guide shows how to access and understand the Deal Performance report in OP, which summarizes inbound activity and deal status across pipelines.
Step 1: Access the Deal Performance Report
- Log in to your Outperform account (Web version).
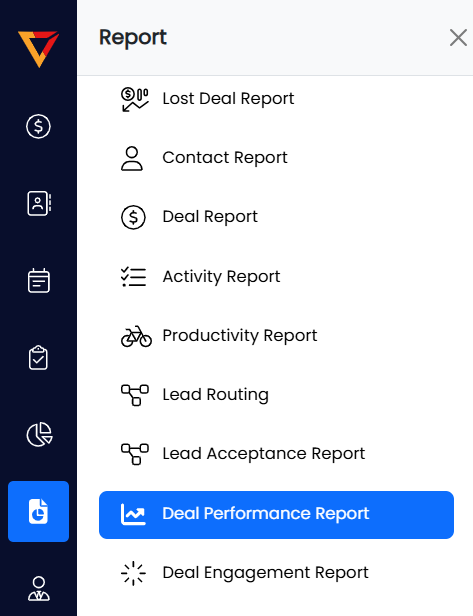
- Click on the Report menu from the left-hand panel.
- Select Deal Performance from the dropdown list.
Step 2: Apply Date Filter (Optional)
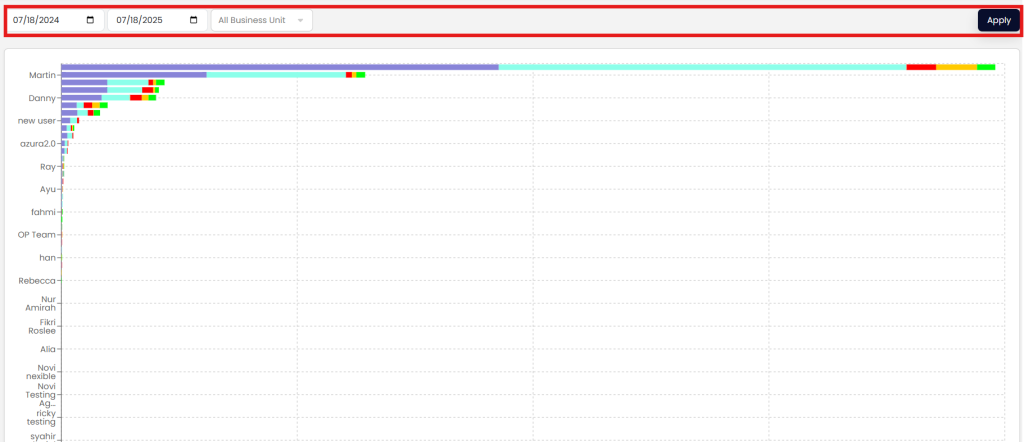
- At the top of the page, use the Date Filter to select your preferred date range.
- After selecting the range, click the Apply button to update the chart.
🔎 Note: The Date Filter only affects the first four metrics in the chart:
- Inbound Leads
- Leads Accepted
- Inbound Calls
- Call Converted
Step 3: Understand the Deal Performance Metrics
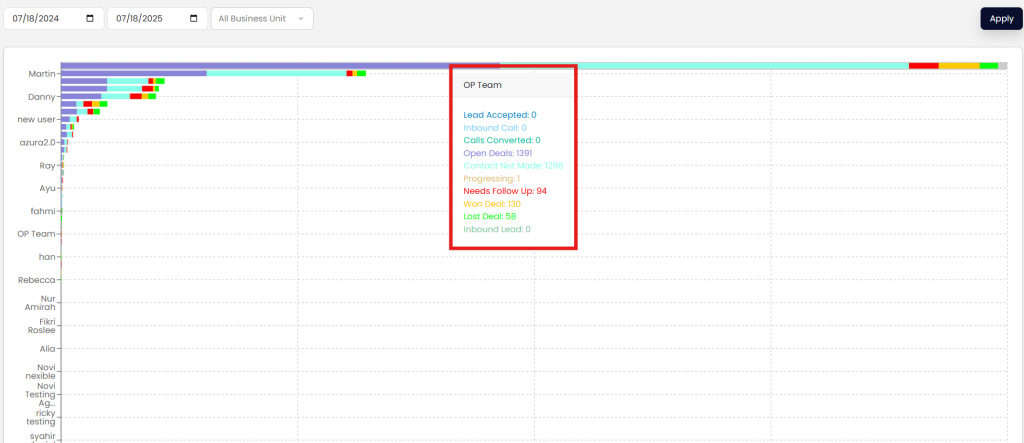
- Hover over any part of the chart to view user-specific data.
- Here’s what the chart legends represent:
- Inbound Leads – New leads received in the system.
- Leads Accepted – Number of leads accepted by sales reps.
- Inbound Calls – Total inbound calls recorded.
- Call Converted – Number of calls successfully converted into deals.
- Open Deals – Total deals that are:
- Contact Not Made (Mint Green)
- Needs Follow-Up (Red)
- Progressing (Brown)
- Won Deals – Total deals marked as won (Yellow).
- Lost Deals – Total deals marked as lost (Green).
Step 4: Explore More Information
- For a detailed breakdown of each metric or deal stage, click here.
Pro Tips
- Use this report regularly to evaluate rep efficiency and conversion effectiveness.
- Focus on high “Contact Not Made” counts to identify leads at risk of stagnation.
- Compare Won vs Lost trends over time for strategic improvements.