
This guide shows how to access and understand the Deal Performance report in OP, which summarizes inbound activity and deal status across pipelines.
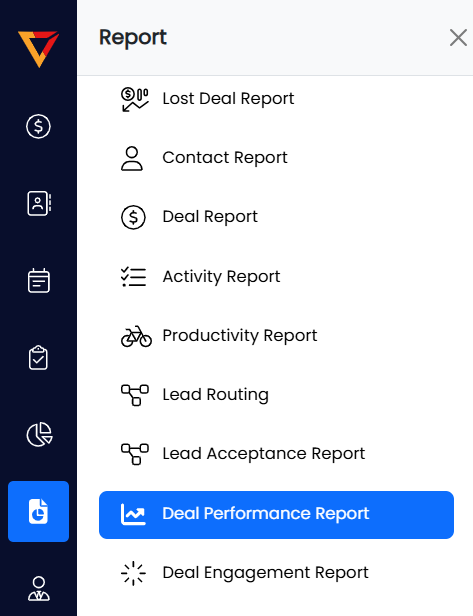
Step 1: Access the Deal Performance Report
- Log in to your Outperform account (Web version).
- Click on the Report menu from the left-hand panel.
- Select Deal Performance from the dropdown list.

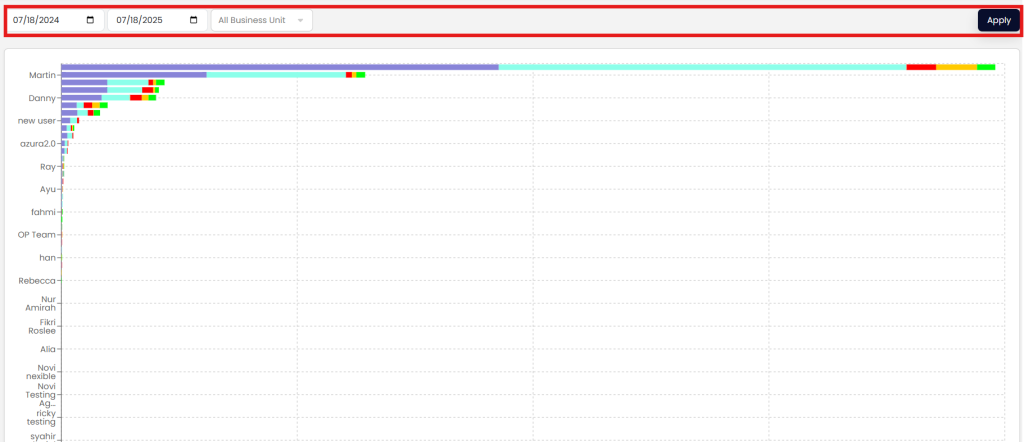
Step 2: Apply Date Filter (Optional)
- At the top of the page, use the Date Filter to select your preferred date range.
- After selecting the range, click the Apply button to update the chart.
🔎 Note: The Date Filter only affects the first four metrics in the chart:
- Inbound Leads
- Leads Accepted
- Inbound Calls
- Call Converted

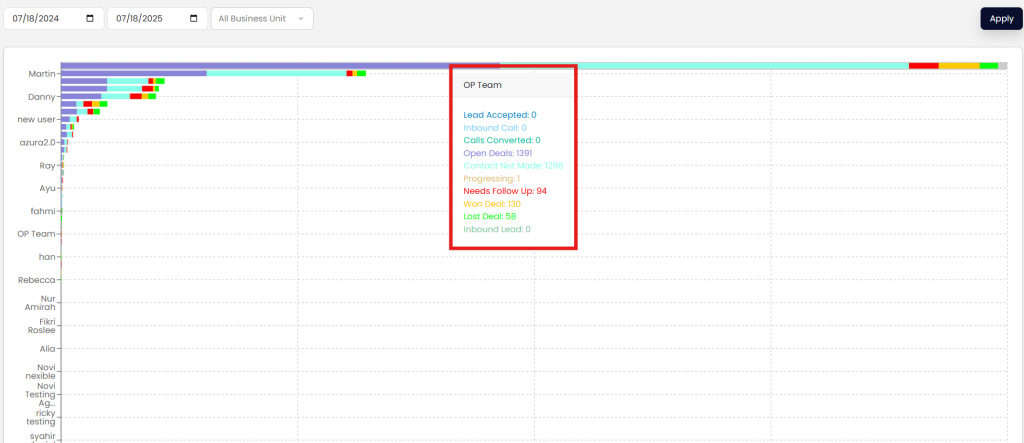
Step 3: Understand the Deal Performance Metrics
- Hover over any part of the chart to view user-specific data.
- Here’s what the chart legends represent:
- Inbound Leads – New leads received in the system.
- Leads Accepted – Number of leads accepted by sales reps.
- Inbound Calls – Total inbound calls recorded.
- Call Converted – Number of calls successfully converted into deals.
- Open Deals – Total deals that are:
- Contact Not Made (Mint Green)
- Needs Follow-Up (Red)
- Progressing (Brown)
- Won Deals – Total deals marked as won (Yellow).
- Lost Deals – Total deals marked as lost (Green).

Step 4: Explore More Information
- For a detailed breakdown of each metric or deal stage, click here.
Pro Tips
- Use this report regularly to evaluate rep efficiency and conversion effectiveness.
- Focus on high “Contact Not Made” counts to identify leads at risk of stagnation.
- Compare Won vs Lost trends over time for strategic improvements.