Description – Deal Performance Report
Deal Performance on Web [Admin/Manager Only]
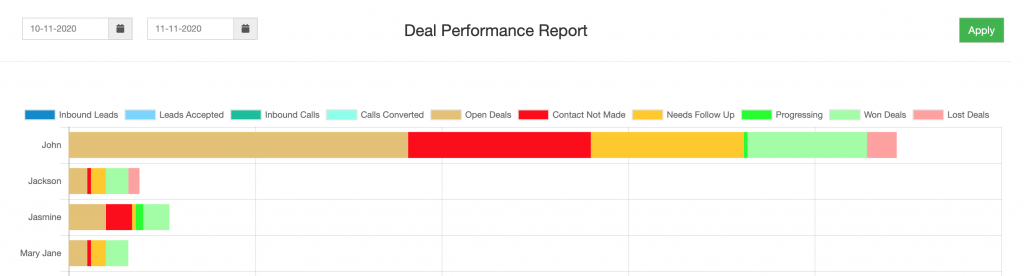
Go to Report > Deal Performance, by default the date range will be 1 day difference.
- Mouse over on the chart to view each sales rep’s performance summary
- Inbound Leads: Total number of leads sent to the sales rep
- Leads Accepted: Total number of leads accepted from the inbound leads
- Inbound Calls: Total number of inbound call routed to the sales rep
- Calls Converted: Total number of call lead is converted as a deal
- Open Deals: Total number deals active/open from all pipelines
- Contact not made: Total number of leads need to be contacted from the total open deals from all pipelines
- Needs Follow Up: Total number of leads require follow up from the total open deals from all pipelines
- Progressing: Total number of leads progressing from the total open deals from all pipelines
- Won Deals: Total number of deals marked as converted/won/keen from all pipelines
- Lost Deals: Total number of deals marked as lost/dropped/not keen from all pipelines