Hi, how can we help you?
How to View and Filter the Main Dashboard in Outperform (OP)
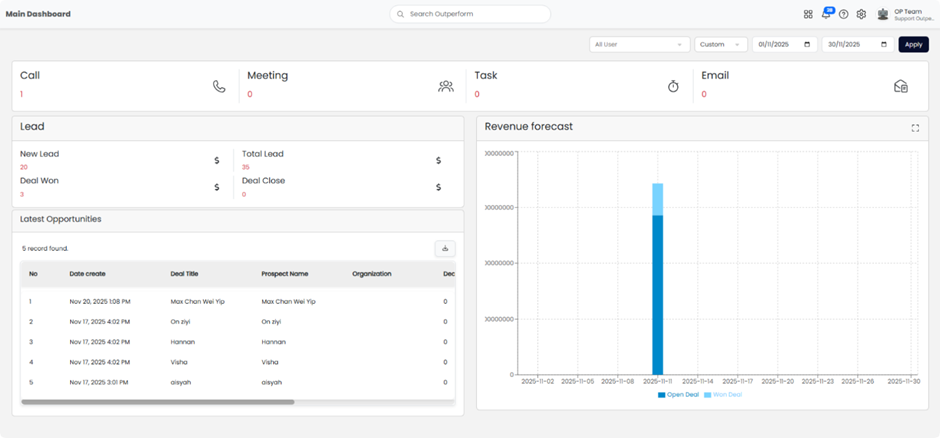
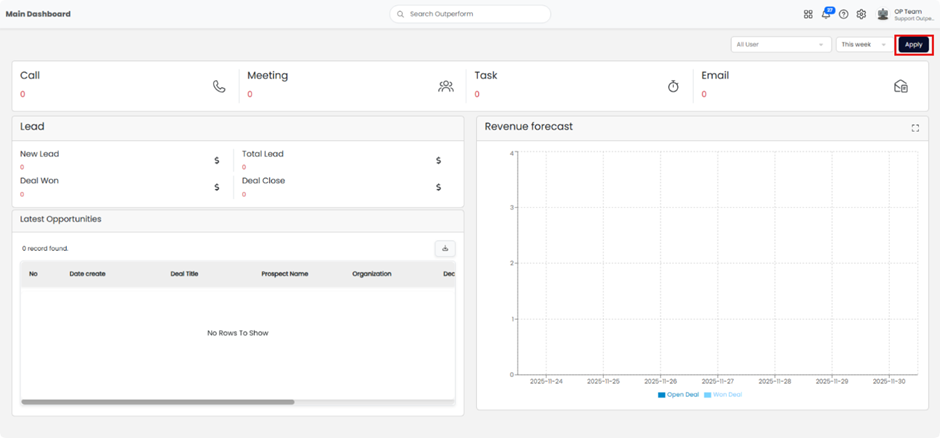
The Main Dashboard serves as your daily command center, designed to help you track your immediate tasks and monitor your performance progress at a glance.
Key Features & Functions:
- Task & Activity Tracking: The top section provides a quick summary of your scheduled Calls, Meetings, Tasks, and Emails, ensuring you never miss an action item for the day.
- Performance Metrics: You can view your current pipeline health, including New Leads, Deals Won, and Revenue Forecasts directly on the screen.
- Default View (“This Week”): To help you focus on immediate priorities, the date filter is set to “This Week” by default every time you access the dashboard.
- User Access: Please note that the User Filter (dropdown menu) is an Admin-only feature. As a Sales Representative, your view is streamlined to display the data relevant to your specific account or team permissions.
Step 1: Open the Main Dashboard
- Log into your OP account.
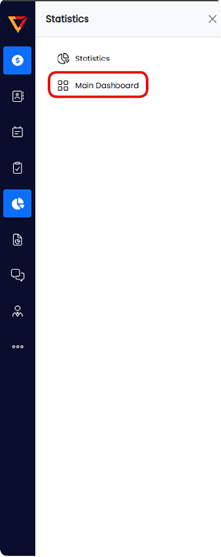
- Navigate to the Statistics section (Pie chart icon on the left menu).
- Click on Main Dashboard — this will open the central reporting screen.
Step 2: Select User Filter
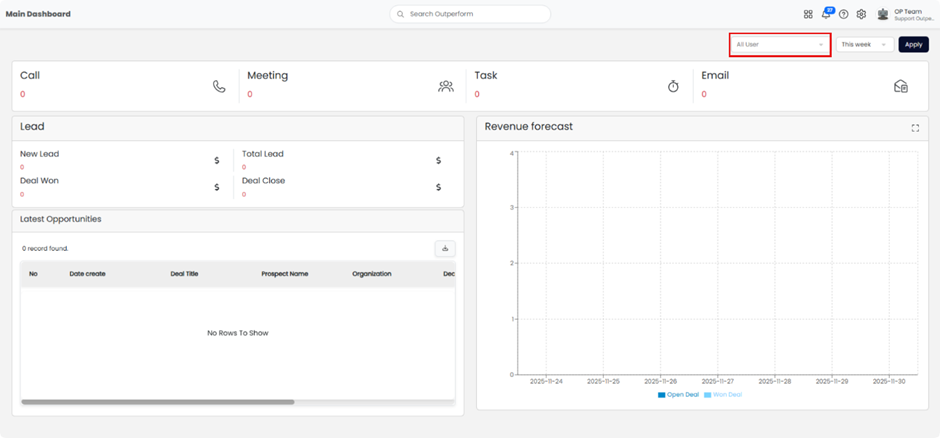
- Locate the filter bar at the top right of the dashboard.
- Click the All-User dropdown menu.
- Select a specific user to view their individual performance or leave it as “All User” to see the team’s total data.
Step 3: Set the Date Range
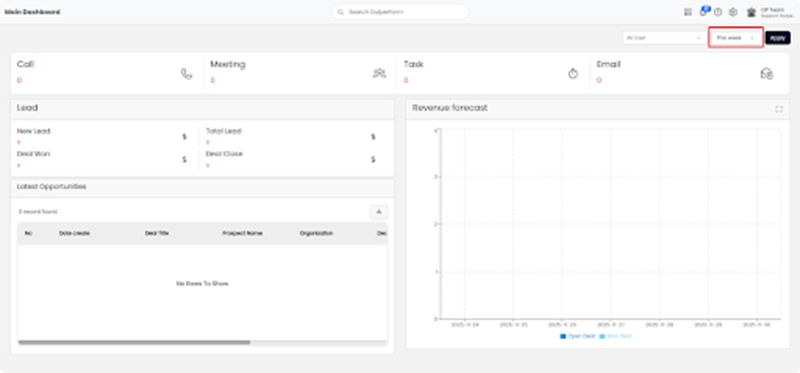
- Click the date dropdown menu (usually defaulting to “This week”).
- Select a preset time frame (e.g., This Week, Last Week).
- For a specific range: Select Custom. Two date fields will appear. Click the calendar icon to choose your Start Date and End Date.
Step 4: Apply Changes
- Once you have selected your User and Date criteria, you must update the view.
- Click the black Apply button on the right.
- The dashboard will refresh to show data relevant to your selection.
Step 5: Analyze the Data
- Review the updated sections on the dashboard:
- Activities: View counts for Calls, Meetings, Tasks, and Emails.
- Lead Status: Track New Leads, Deals Won, Total Leads, and Closed Deals.
- Latest Opportunities: A detailed table listing recent deals, prospect names, and organizations.
- Revenue Forecast: A visual bar chart showing Open vs. Won deals over the selected timeline.