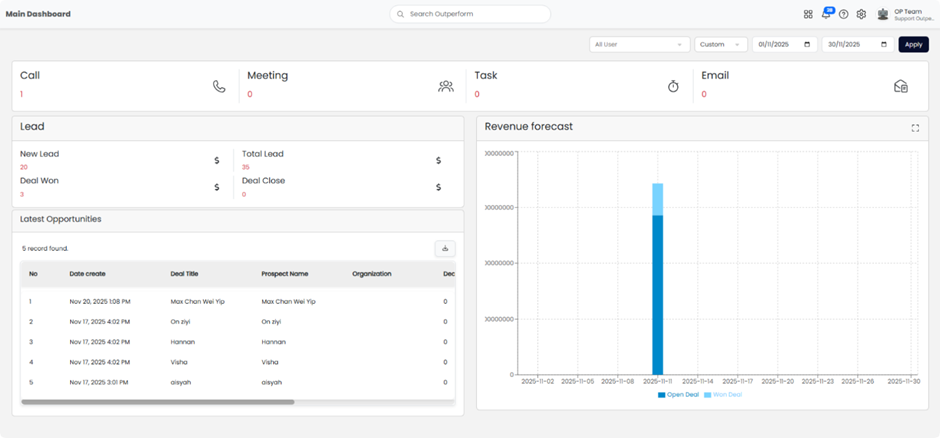
The Main Dashboard serves as your daily command center, designed to help you track your immediate tasks and monitor your performance progress at a glance.
Key Features & Functions:
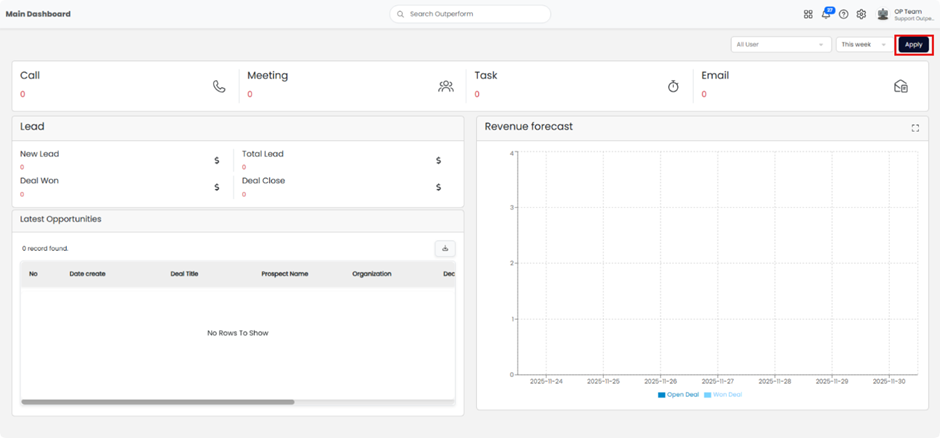
- Task & Activity Tracking: The top section provides a quick summary of your scheduled Calls, Meetings, Tasks, and Emails, ensuring you never miss an action item for the day.
- Performance Metrics: You can view your current pipeline health, including New Leads, Deals Won, and Revenue Forecasts directly on the screen.
- Default View (“This Week”): To help you focus on immediate priorities, the date filter is set to “This Week” by default every time you access the dashboard.
- User Access: Please note that the User Filter (dropdown menu) is an Admin-only feature. As a Sales Representative, your view is streamlined to display the data relevant to your specific account or team permissions.
Step 1: Open the Main Dashboard
- Log into your OP account.
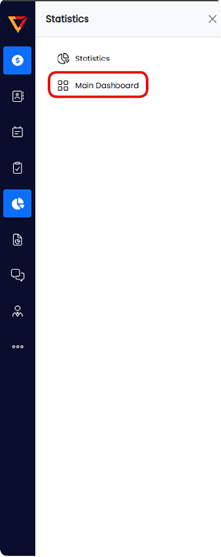
- Navigate to the Statistics section (Pie chart icon on the left menu).
- Click on Main Dashboard — this will open the central reporting screen.

Step 2: Select User Filter
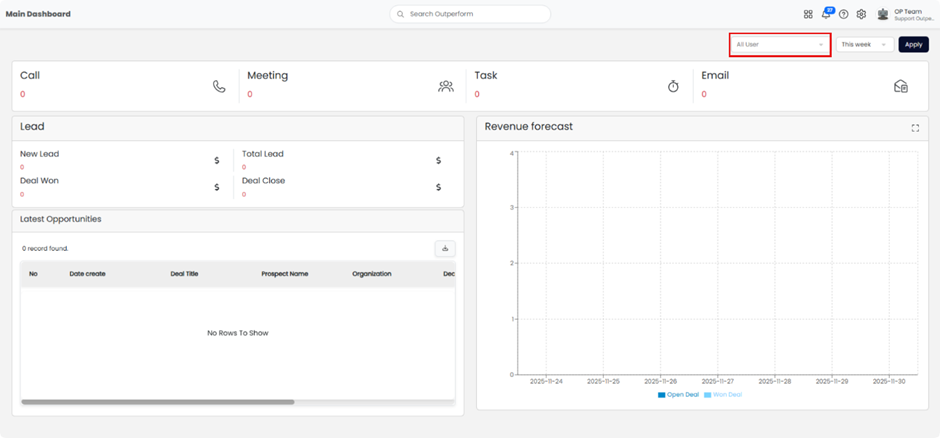
- Locate the filter bar at the top right of the dashboard.
- Click the All-User dropdown menu.
- Select a specific user to view their individual performance or leave it as “All User” to see the team’s total data.

Step 3: Set the Date Range
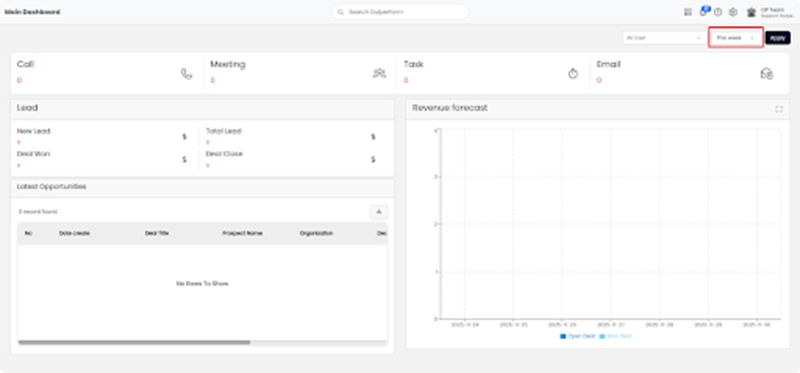
- Click the date dropdown menu (usually defaulting to “This week”).
- Select a preset time frame (e.g., This Week, Last Week).
- For a specific range: Select Custom. Two date fields will appear. Click the calendar icon to choose your Start Date and End Date.

Step 4: Apply Changes
- Once you have selected your User and Date criteria, you must update the view.
- Click the black Apply button on the right.
- The dashboard will refresh to show data relevant to your selection.
Step 5: Analyze the Data
- Review the updated sections on the dashboard:
- Activities: View counts for Calls, Meetings, Tasks, and Emails.
- Lead Status: Track New Leads, Deals Won, Total Leads, and Closed Deals.
- Latest Opportunities: A detailed table listing recent deals, prospect names, and organizations.
- Revenue Forecast: A visual bar chart showing Open vs. Won deals over the selected timeline.