Hi, how can we help you?
How to view an inbound analytics report?
This guide shows Admin users how to access and filter the Inbound Analytics report in OP, including using time-based filters, marketing categories, and more.
User on Web [Admin Only]
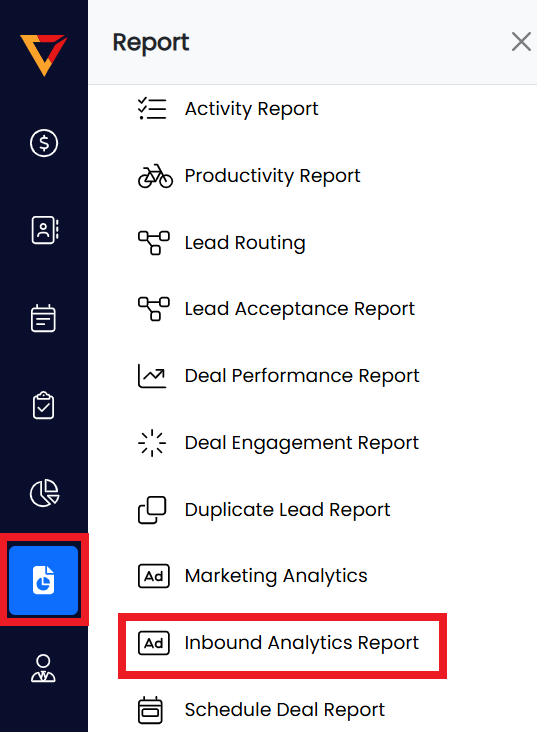
Step 1: Access the Inbound Analytics Report
- Log in to your OP Admin account (Web version only).
- Click on Report from the left-hand menu.
- Select Inbound Analytics from the dropdown list.
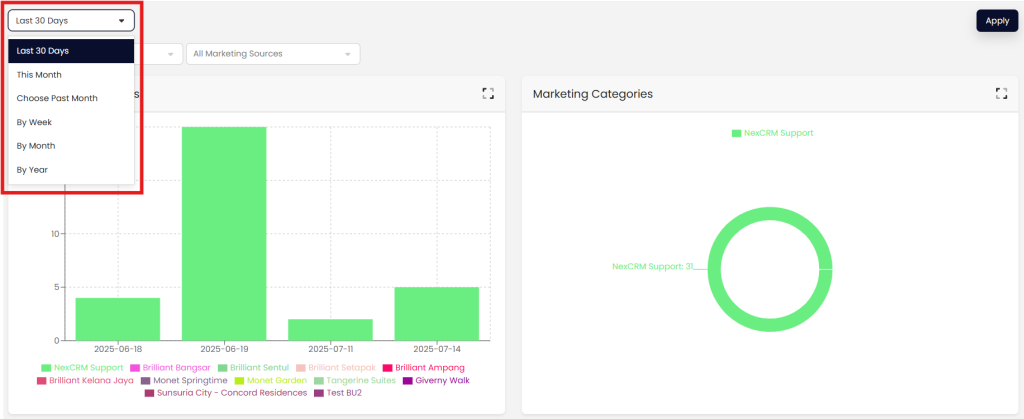
Step 2: Apply Date Filters
At the top left of the page, use the Date Filter to customize the data view. Available options include:
- Last 30 Days – Displays data captured in the last 30 days.
- This Month – Shows only the data collected in the current calendar month.
- Choose Past Month – Allows you to select a specific past month for targeted analysis.
- By Week – Filters the report to show weekly data.
- By Month – Aggregates the data month by month.
- By Year – Summarizes the data on a yearly basis.
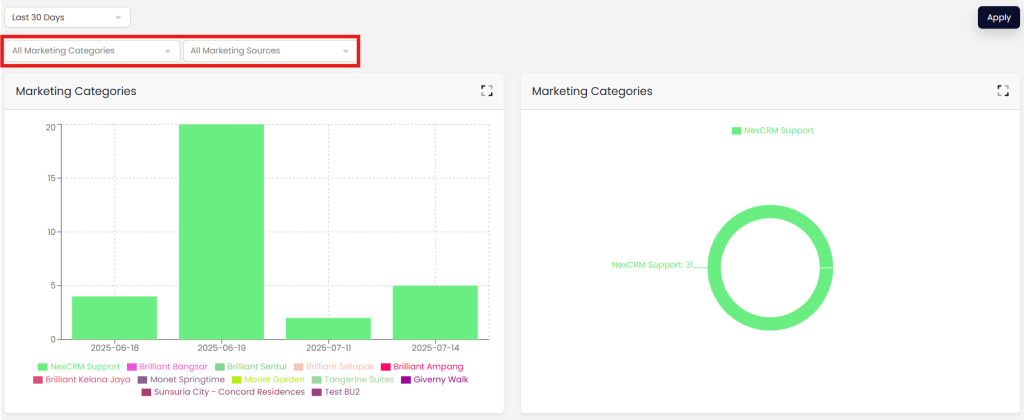
Step 3: Use Marketing Filters
- Use the Marketing Categories and Marketing Sources dropdowns to refine the chart data based on campaign or channel specifics.
Step 4: Interact with Charts
- Hover over the bar chart or pie chart to preview detailed data points.
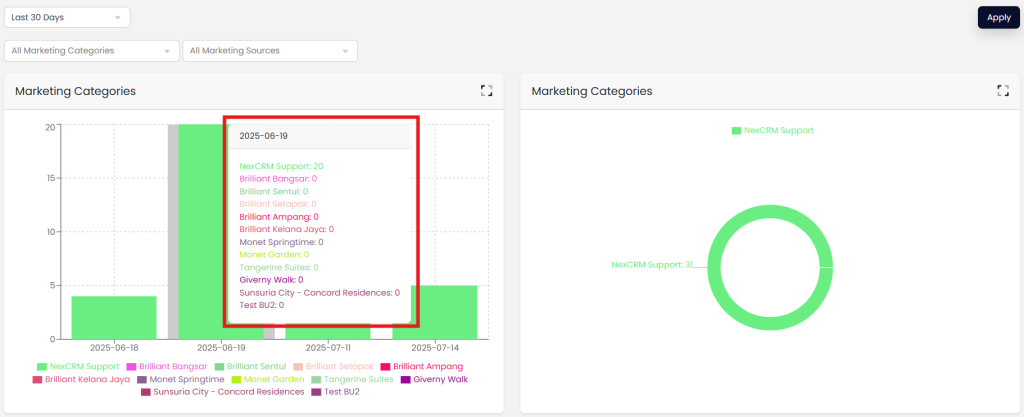
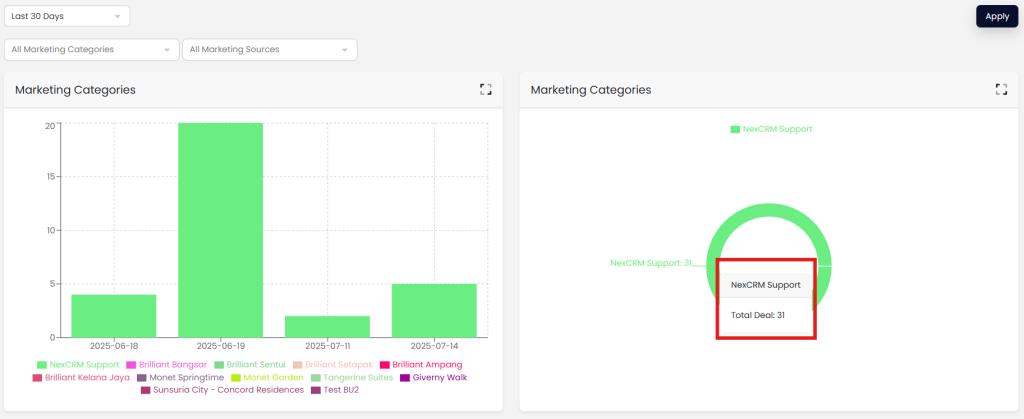
- Click on any chart element to drill down into the corresponding deal data in the Deal Report view.
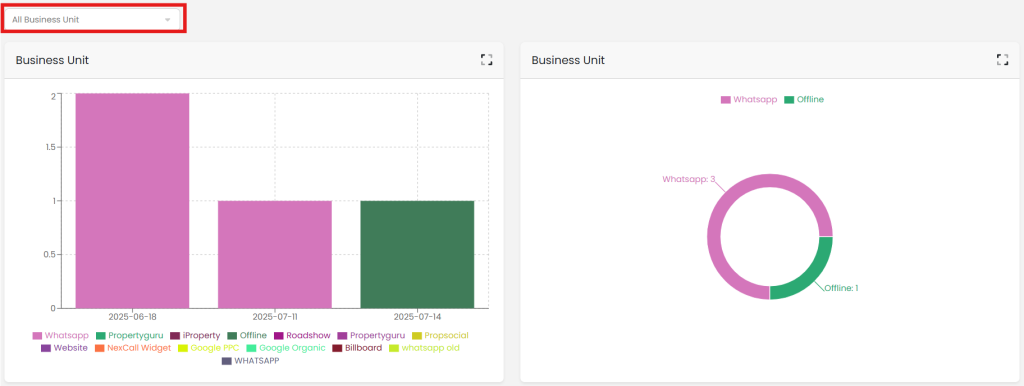
Step 5: Filter by Business Unit
- Use the Business Unit Filter (typically located on the right) to narrow the report results by specific business units.
Pro Tips
- Combining Marketing Source and Date Filters gives you sharper insights into campaign effectiveness.
- Clicking charts not only shows you related deals but also helps identify trends across different time frames or units.
- Use the report for quarterly reviews and marketing ROI analysis.