User on Web
Login to your OutPerform account.
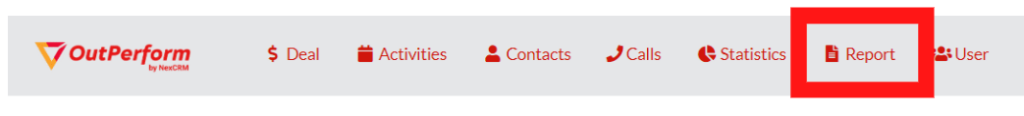
Step 1: Click the Report page.

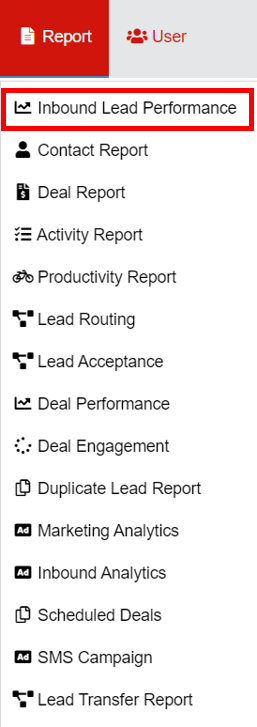
Step 2: Select the Inbound Lead Performance.

Step 3: We can use the date filter to display specific date range data.

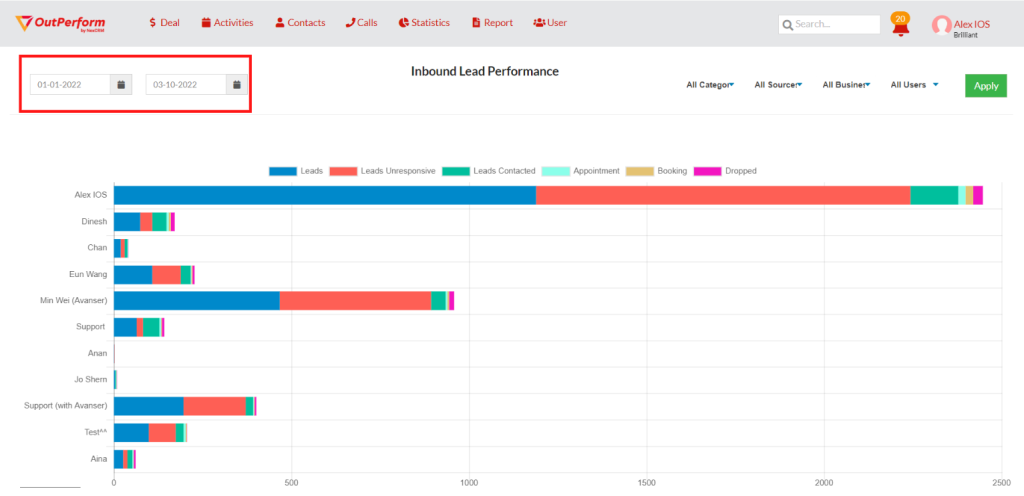
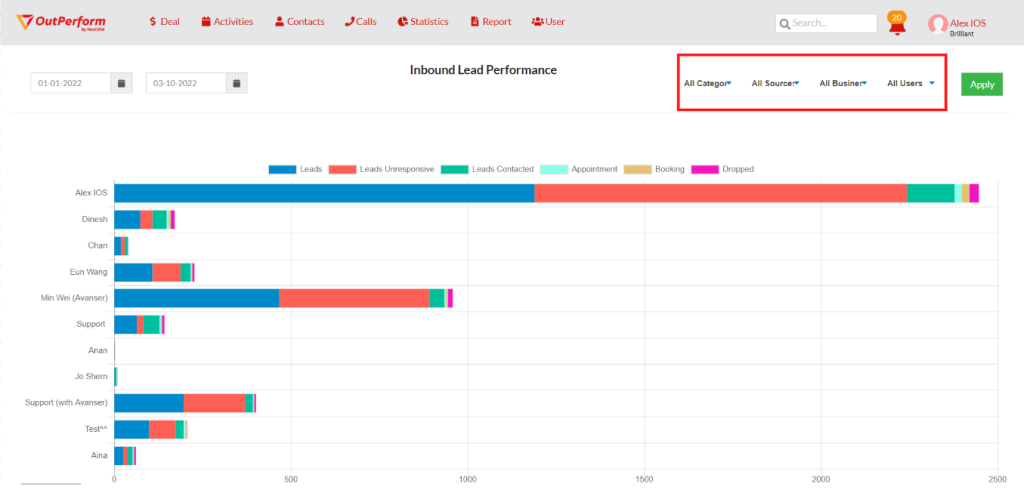
Step 4: We can select the filter for categories, deal source, business unit and users.

Step 6: Click the Apply button at the top right.
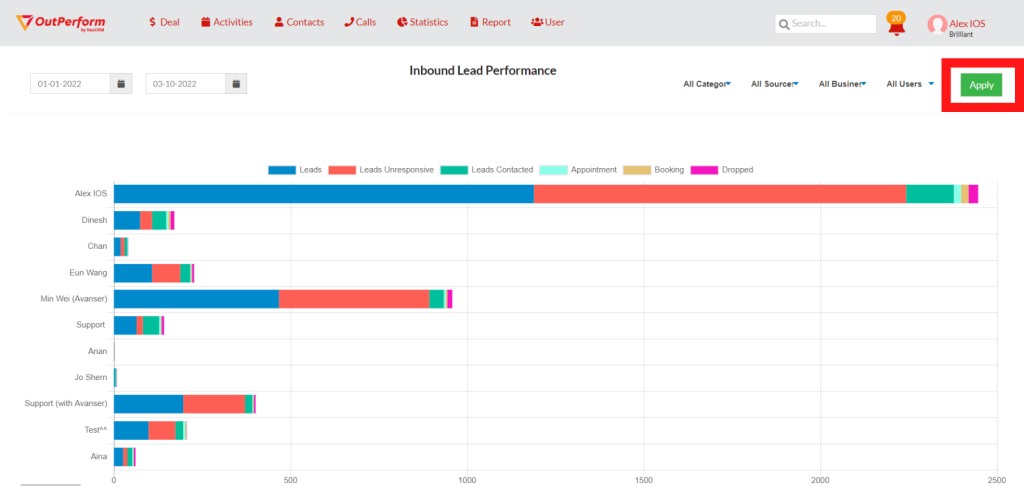
Step 7: The data will be shown inside the chart table.

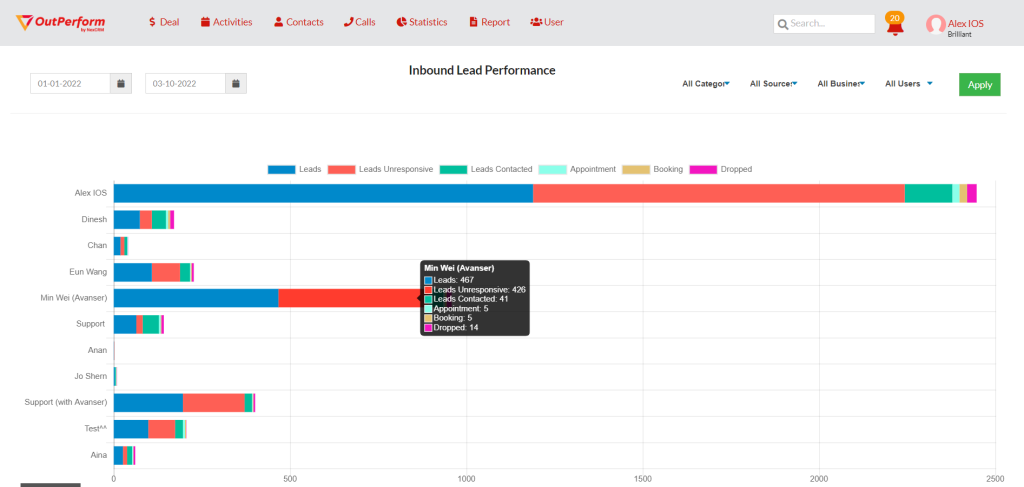
- Leads: Total number of deals that for the selected date range from all pipeline
- Lead Unresponsive: Total number of lead with status Not Contacted in all pipeline
- Leads Contacted: Total number lead with status Progressing and Follow up in all pipeline
- Appointment: Total number of meeting activity created for total leads in all pipeline
- Booking: Total number of deals marked as won in the default marketing pipeline (final conversion pipeline)
- Dropped: Total number of deals marked as lost
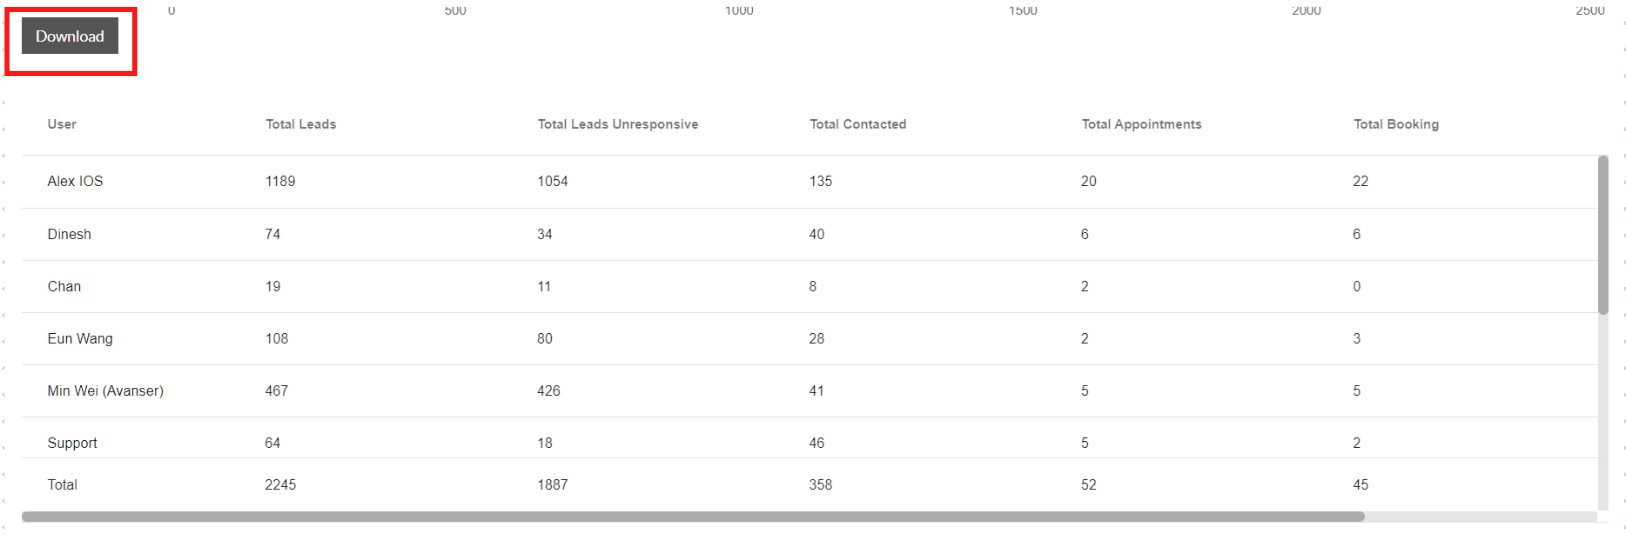
Step 8: There is a table view data under the chart view. The data in this table follows the filters applied.

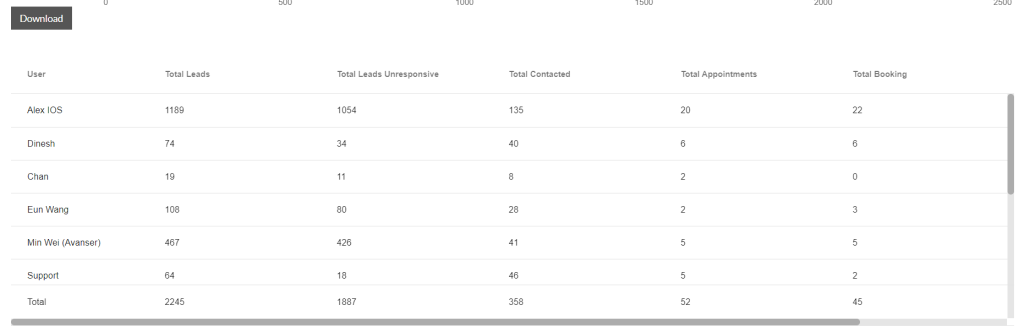
Step 9: Click the download button to download the data inside an excel file.