This guide helps you access and understand the Marketing Analytics report in OutPerform, which displays the total number of unique leads per deal source for a selected date range and pipeline.
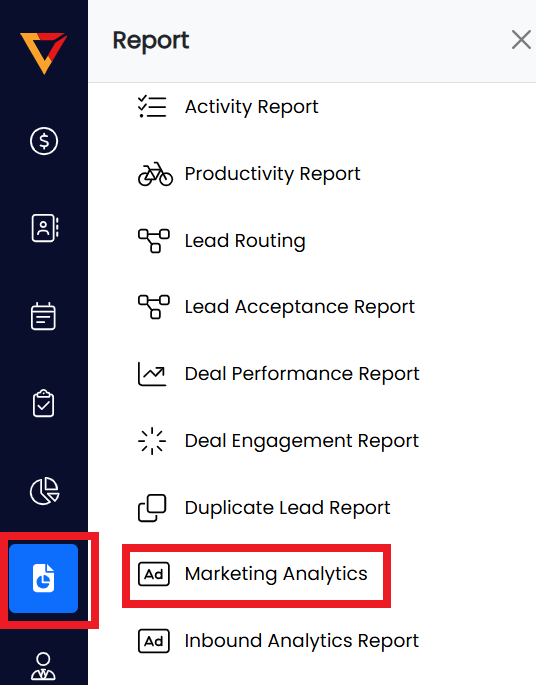
Step 1: Access the Report Section
Log in to your OutPerform (OP) account.
From the left menu, click on the 📈 Report section.
In the dropdown menu, select Marketing Analytics.

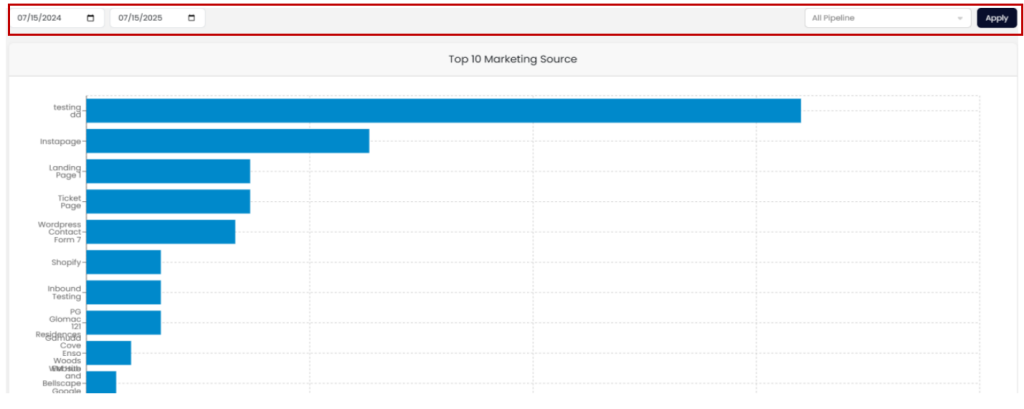
Step 2: Apply Filters for Date & Pipeline
Once your filters are set, click the Apply button to update the report view..
Use the Date Range filter to select the desired timeframe for your report.
Use the Pipeline filter to narrow down results based on the sales pipeline.
Step 3: Explore the Chart Data
You can download the chart and report by clicking the Download button.
Hover your cursor over the deal source chart to view detailed lead data.
Each deal source will show the count of unique leads attributed to it.

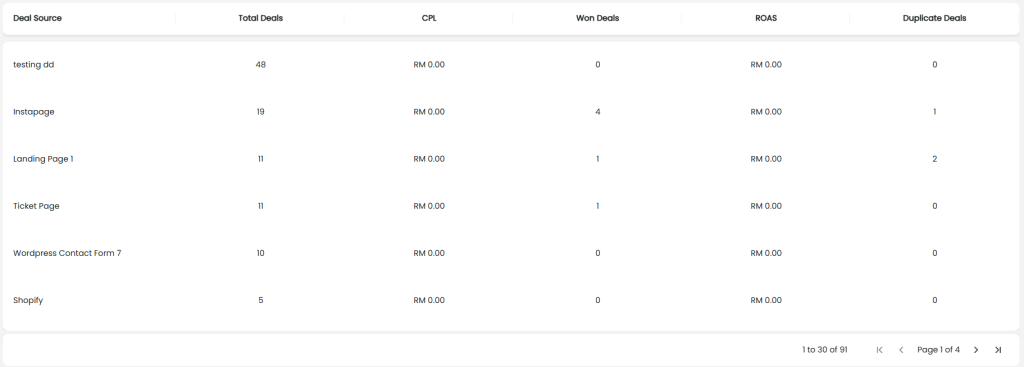
Step 4: View Table Summary
Data reflects only deals created by the person assigned to them.
Scroll down to view the Marketing Analytics Table.
The table provides a breakdown of unique leads by deal source.